The U.S. Postal Service has made changes to its plans to retrofit its fleet, planning for at least 40% of an order of 84,500 vehicles to be battery electric vehicles (BEVs). This is an increase from the 20% of an order of 50,000 vehicles previously planned, and comes after complaints by environmental groups, states, and the Biden Administration.
USPS’ fleet of 212,000 vans is the largest civilian vehicle fleet in the world, and President Biden has set a goal to move all federal vehicles to BEVs by 2035. Given that many USPS vehicles are more than 30 years old, if USPS buys any new gasoline-powered vehicles they may still be on the road in 2035 and could cause this goal to be missed.
The volume of vehicles which USPS plans to purchase is still small compared to the overall U.S. EV market. U.S. consumers bought 608,000 BEVs and plug-in hybrid electric vehicles (PHEVs) in 2021, or roughly 4% of the 14.9 million cars, pickups, and sport utility vehicles sold during the year. However, it could spur more production of short-range delivery vehicles that could be used by other fleets, thus increasing overall U.S. electrification.
USPS is holding a public hearing on the new order on August 8, 2022. It plans to take written public comment through August 15. Once finalized, USPS expects the first vehicles to arrive under this new order in 2023.
https://sunandwindbelt.com/wp-content/uploads/2022/06/LOGO-SW_WEB-abstand.svg00Sophia.Tischingerhttps://sunandwindbelt.com/wp-content/uploads/2022/06/LOGO-SW_WEB-abstand.svgSophia.Tischinger2022-07-26 23:17:542022-07-26 23:17:55U.S. Postal Service to Increase EV Purchases
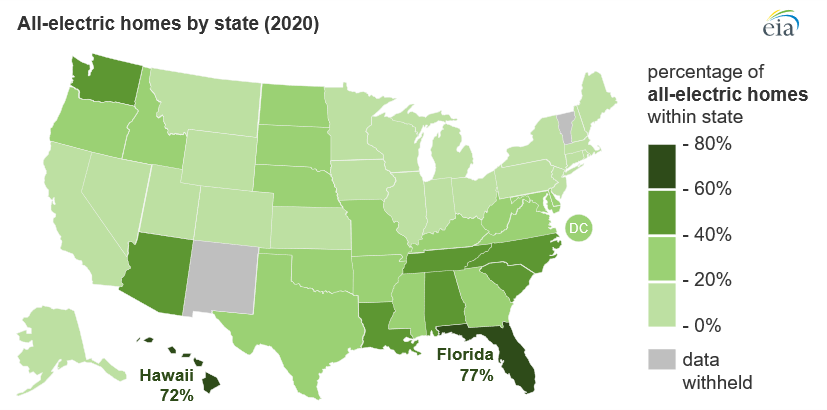
The U.S. Department of Energy’s Energy Information Administration (EIA) has published a state-by-state analysis of the degree of electrification of homes in the United States, finding that in 2020 26% of U.S. homes were all-electric. This information provides a baseline for electrification efforts and shows the need for attention in certain regions. The portion of all-electric homes varies widely from state to state, from a high of 77% in Florida to a low of 7% in New York and Michigan.
Source: EIA
EIA observes that in colder climates most homes use natural gas, fuel oil, and/or propane for space and water heating. A map released by EIA confirms this, showing that less than 20% of homes in all states in the Northeast and Midwest are all-electric. California is an outlier; despite a mild climate only 8% of California homes are all-electric.
The information provided by EIA comes amid both a movement by cities, counties, and states to mandate electrification of new buildings (See “Washington D.C. Passes Climate, All-Electric Buildings bills”) and a wave of states passing laws to prohibit municipalities from passing these all-electric mandates. It also follows U.S. natural gas hitting its highest monthly price in 14 years in May 2022.
However, in many cases the states that have passed laws pre-empting municipal electrification mandates either already have high rates of all-electric buildings and/or have smaller populations. While Alabama, Arizona, Florida, Louisiana, and Tennessee are among the 20 states that have pre-empted municipal gas bans, in all these states more than 40% of homes were already all-electric in 2020. This suggests that state pre-emption will not necessarily have a major impact in terms of prolonging gas as the dominant fuel for meeting U.S. residential energy needs.
EIA also supplied information on the uses of electrification in homes. While 88% of homes use electricity for air conditioning, only 33% of homes use electricity for space heating. Rates of electricity use for water heating, cooking, and clothes drying fell between these two numbers.
https://sunandwindbelt.com/wp-content/uploads/2022/06/LOGO-SW_WEB-abstand.svg00Sophia.Tischingerhttps://sunandwindbelt.com/wp-content/uploads/2022/06/LOGO-SW_WEB-abstand.svgSophia.Tischinger2022-07-26 23:16:012022-07-26 23:16:0226% of U.S. Homes Were Already All-Electric in 2020
The City Council of Washington D.C. has approved two bills that increase the city’s greenhouse gas reductions targets and as well as setting in place concrete measures to implement these reductions, particularly in the buildings sector. This includes net-zero and all-electric mandates for broad categories of new buildings, starting in 2025 and 2027, as well as mandating that the city only purchase electric vehicles for city government use.
Washington D.C. Mayor Muriel Bowser has expressed support for both bills, and upon signing they will give Washington D.C. stronger economy-wide greenhouse gas reduction targets than any U.S. state. This follows on New York City mandating all-electric buildings in December 2021, and dozens of cities and counties in California passing similar measures.
The Climate Commitment Act of 2021 begins by requiring a 45% reduction in economy-wide greenhouse gas emissions by 2025, a 60% reduction in 2030, and additional targets to reach carbon neutrality by 2045. As part of this, it mandates that the district shall not install any fossil fuel infrastructure in any of its buildings during initial construction or major renovations, including city schools, starting in 2025. In addition, it mandates that the city purchase only zero-emissions vehicles starting in 2026.
The second bill, the Clean Energy DC Building Code Amendment Act of 2021, will require that all new construction and substantial improvements will have to meet a net-zero energy standard starting in 2027. This includes a ban on installing appliances that burn fossil fuels in these buildings which applies to all commercial buildings as well as residential buildings four stories and higher.
This will make Washington D.C. the second city on the East Coast to mandate all-electric new buildings, and likely not the last. Legislation was introduced in Maryland, New York, and Rhode Island to mandate all-electric new buildings in the most recent legislative sessions.
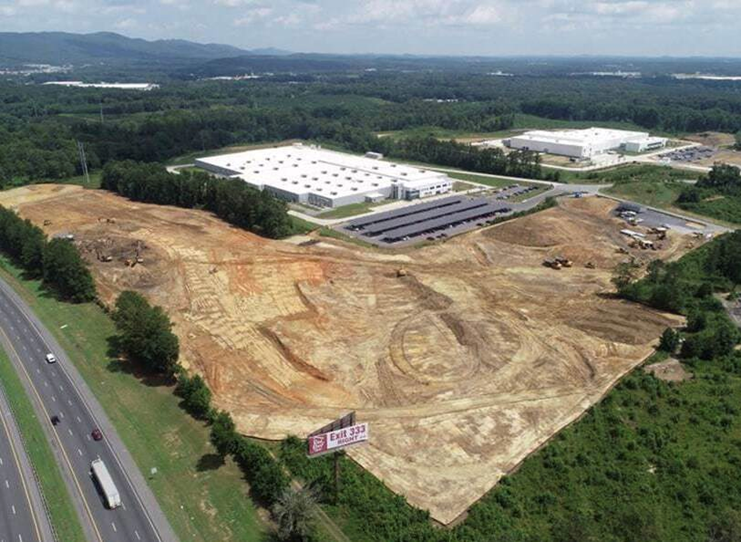
QCells North America has begun preparing the site for a second factory building at its production site in Dalton in the U.S. state of Georgia. The new building will host the capacity to assemble an additional 1.4 gigawatts of solar PV modules per year, with initial operation planned for the second half of 2023. This adds to QCells’ existing 1.7 gigawatts of production capacity at the site. QCells will host around one quarter of the nation’s total solar module manufacturing capacity when this facility and another under construction by First Solar are complete in 2023.
The modules made in the factory will feature high-efficiency cells which utilize tunnel oxide passivated contact (TOPCon) technology. These are more expensive than the standard passivated emitter and rear cell (PERC) cells that are standard in solar production, and the modules made from them will primarily serve the residential and commercial and industrial solar markets. CEA has confirmed that these cells will be imported from cell factories in Korea owned by QCells’ parent company Hanwha.
Photo: Scott Moskowitz, Twitter
Despite this expansion and a 3.3-gigawatt factory under construction by First Solar in Ohio, the United States is expected to remain dependent on imported solar modules to meet demand. Wood Mackenzie’s latest estimate is that the United States will install 18 gigawatts-DC of PV modules in 2022, far more than its 8 gigawatts of module production capacity. In 2023 the United States is expected to install 26 gigawatts of solar, and with these two factories will have only 12.7 gigawatts of module capacity by the end of the year. Actual production of U.S modules will be lower than these figures, given that U.S. factories are not running at full utilization.
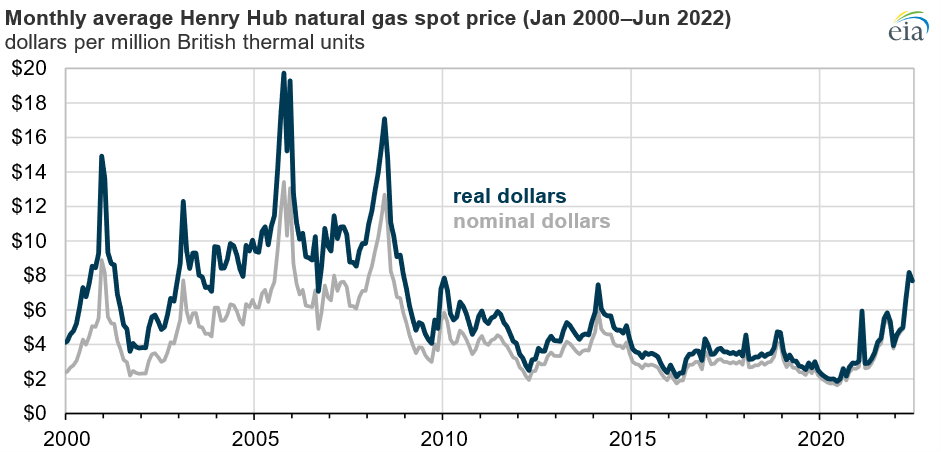
While prices for solar and wind have been rising in the United States, recent data from the U.S. Department of Energy indicate that natural gas prices have been rising faster. The U.S. Department of Energy’s Energy Information Administration (EIA) reports that prices at Henry Hub in Louisiana, which set a benchmark price for U.S. gas prices, have increased 101% from $3.84 per million British Thermal Units (MMBtu) in July 2021 to $7.70/MMBtu in June 2022.
This June price shows a slight decline from prices of $8.17/MMBtu in May 2022, the highest price since November 2008. EIA states that prices have generally increased since mid-2021 as “demand growth has outpaced domestic production growth, keeping inventory levels low.”
An important driver of sharply rising gas prices in the United States is the growth of liquefied natural gas (LNG) exports. The nation has now surpassed both Qatar and Australia as the world’s largest exporter of LNG. EIA notes that due to this increased domestic and global demand, the United States entered April 2022 with the lowest natural gas storage level in almost three years. Further reflecting the connections between U.S. and global markets, a fire at the Freeport LNG terminal in Texas in early June has both reduced gas prices for U.S. consumers and raised EU gas prices.
These increases in the wholesale price of natural gas are being felt at the retail level as well. The most recent Consumer Price Index (CPI) report shows the price of utility gas service rising 38.4% year-over-year. This is the third-steepest increase among the consumer goods considered. CPI also showed that retail electricity prices have increased 13.7% year-over-year, the fourth-sharpest increase.
https://sunandwindbelt.com/wp-content/uploads/2022/06/LOGO-SW_WEB-abstand.svg00Sophia.Tischingerhttps://sunandwindbelt.com/wp-content/uploads/2022/06/LOGO-SW_WEB-abstand.svgSophia.Tischinger2022-07-26 23:08:472022-07-26 23:08:48U.S. Natural Gas Prices Doubled Year-over-Year in June
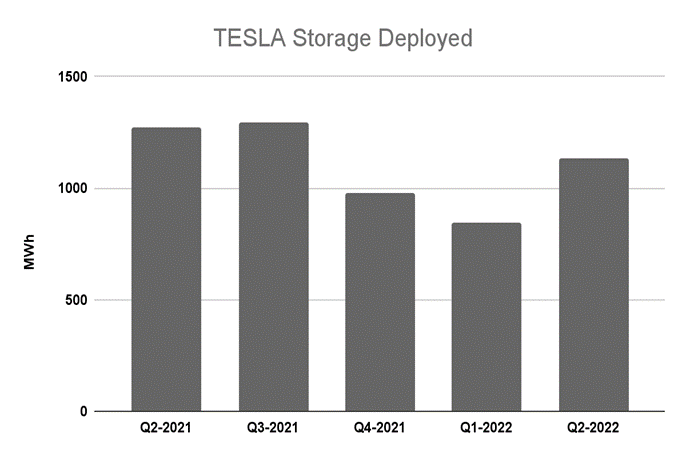
Tesla deployed more than 1 gigawatt-hour of battery energy storage systems in the second quarter of this year, but the company has been suffering from parts supply issues. In announcing quarterly financial results on 19 July, Tesla said a global semiconductor shortage was a major factor behind the 11% year-over-year decline in energy storage deployments.
Production of Tesla’s residential Powerwall battery cells and Megapack 3 megawatt-hour (MWh) utility-scale system “remains component-constrained,” Chief Financial Officer Zachary Kirkhorn said during a conference call discussing the results. Kirkhorn said the company hopes the situation will ease in the second half of the year.
In the second quarter of 2022, Tesla deployed 1133 MWh of storage, compared to 1274 MWh in the same period in 2021 and 1295 MWh in the third quarter of 2021. However, this figure has increased compared to the fourth quarter of 2021 (978 MWh) and the first quarter of 2022 (846 MWh).
The semiconductor shortage has had a bigger impact on the company’s energy business than its core automotive segment, although the good news appears to be that the company is reporting strong customer demand. Tesla is ramping up Megapack production as demand continues to outstrip supply.
As stated in the company’s Q2 release: “Demand for our storage products remains in excess of our ability to supply. We are in the process of ramping production at our dedicated Megapack factory to address the growing demand.”
Access to lithium-ion battery cells and availability of raw materials such as lithium, nickel and cobalt remain a concern for Tesla. In the earnings call CEO Elon Musk called upon entrepreneurs to “enter the lithium refining business.” To grow the energy storage business, Tesla will require substantially more cells from suppliers such as Panasonic & CATL. Musk remarked that battery production is a “fundamental limiting factor” in the global energy transition.
https://sunandwindbelt.com/wp-content/uploads/2022/06/LOGO-SW_WEB-abstand.svg00Sophia.Tischingerhttps://sunandwindbelt.com/wp-content/uploads/2022/06/LOGO-SW_WEB-abstand.svgSophia.Tischinger2022-07-26 23:06:122022-07-26 23:06:14Component Constraints Limit Tesla Battery Deployments in Q2
New research from Level10 Energy shows U.S. solar and wind PPA prices rising nearly 30% over the last year. Using price offers from its energy marketplace, Level10 Energy shows North American wind prices increased 13% in the second quarter of 2022 to $33.91 per megawatt-hour (MWh), with solar prices increasing more than 3% to $36.33/MWh. When compared to the previous year, Level10 Energy says that these prices are nearly 30% higher.
These are “P25” prices, meaning that they refer to the most competitive 25th percentile offer price. These prices are for a variety of start dates, with average contract lengths in the 10 – 15-year range and include the value of renewable energy credits (RECs).
Price increases were very different across grid operator service areas, with sharp increases over the past six months for solar in the Midcontinent System Operator, PJM Interconnection, and Southwest Power Pool (SPP) grids, which cover the U.S. East Coast, Midwest to the Rocky Mountains, and part of the South. Prices for solar contracts in these three regions are now $44/MWh and above. This is in sharp contrast to statewide grids in Texas and California, where prices did not change as much and are in the $32-$34/MWh range. For wind, prices have fallen sharply in PJM but rose in SPP. They show a very large range across grid operator, from a low of under $30/MWh in Texas to above $60/MWh in California.
Level10 cites several reasons for rising PPA prices, including “ongoing permitting difficulties, congested interconnection queues, a fractured supply chain, and powerful inflationary factors.” It also cites the impact of the anti-circumvention investigation against Southeast Asian solar products as creating “near-paralysis” in the solar industry during Q2 2022.
However, Level10 also notes that as renewable energy prices increase, so have wholesale electricity prices. The company observes that “the value of wind and solar PPAs remains high, even as their prices increase.”
Level10’s finding that some of the rising PPA prices reflect rising costs is echoed by global data by Bloomberg New Energy Finance (BloombergNEF), which found that the levelized cost of electricity (LCOE) from both new-build solar and onshore wind increased during Q2 2022. BloombergNEF reports the average LCOE from onshore wind increased 7% year-over-year to $46/MWh while solar rose 14% year-over-year to $45/MWh.
BloombergNEF cited rising cost of “materials, freight, fuel, and labor” for solar and wind LCOE increases. Regardless, both sources remain much lower cost than new-build gas-fired generation ($81/MWh) or coal-fired generation ($74/MWh).
On 21 July, 2022, the Massachusetts legislature passed a clean energy bill to accelerate zero-carbon solutions in the electricity, transportation, and buildings sectors, including accelerating offshore wind deployment and setting a phase-out date for petroleum-fired passenger vehicles. Top-line actions of “An Act Driving Clean Energy and Offshore Wind” include:
Mandates that the state’s utilities contract for a minimum of 5600 megawatts of offshore wind by 2027
Mandates that passenger vehicles sold in-state must be zero-emissions by 2035
Provides EV rebates of up to $5000, with an additional $1500 rebate for low-income individuals
Removes a cap on solar installations up to 25 kW under the state’s net metering program
The wide-ranging bill makes a number of other changes. These include reducing incentives for fossil fuel equipment starting in 2025, requiring building energy use reporting for large buildings, setting up a pilot programs for fossil-free building renovations, and requiring electric utilities to submit proposals for time-of-use rates.
The bill represents a reconciliation of two different bills that previously passed the House and Senate, and now goes to Massachusetts Governor Charlie Baker for approval. Sierra Club has described the bill as a “landmark” and noted that it will make it easier for the state to achieve its target of reducing emissions 50% economy-wide by 2030.
The bill does not accelerate Massachusetts’ Clean Energy Standard, which requires that the portion of clean energy sources (defined as having emissions 50% below the most efficient gas generator) increases 2% annually to reach 80% of electricity in 2050. But by increasing the offshore wind target, it is mandating a faster move to renewables in electricity. Using Vineyard Wind’s estimated capacity factor of 45%, 5600 megawatts of offshore wind would generate electricity equivalent to 46% of the state’s retail electricity sales in 2021.
The bill’s requirement that only zero-emissions vehicles can be sold after 2035 follows on an executive order signed by California Governor Newsom in September 2020 creating a similar requirement for new vehicles. Seven other states including Massachusetts followed California’s lead, but Massachusetts’ Clean Energy and Offshore Wind bill takes the rare step of writing this requirement into law, instead of acting solely through state regulations.
https://sunandwindbelt.com/wp-content/uploads/2022/06/LOGO-SW_WEB-abstand.svg00Sophia.Tischingerhttps://sunandwindbelt.com/wp-content/uploads/2022/06/LOGO-SW_WEB-abstand.svgSophia.Tischinger2022-07-26 22:59:332022-07-26 22:59:34Massachusetts Passes Multi-Sector Clean Energy Bill
Senator Manchin`s use of inflation as a rationale for killing clean energy tax credits contrasts with rising prices for fossil fuesl. Image: Third Way Think Tank, Flickr. Licensed under Creative Commons CC-by-NC-ND 2.0.
On 14 July, U.S. Senator Joe Manchin announced that he would not back clean energy tax credit provisions in the “reconciliation” bill that has been under negotiations for months. This comes after Manchin stopped the Build Back Better bill in December 2021 by withdrawing his support. As Manchin was a key vote in a 50-50 senate, Democrats are now pursuing a bill with only health care provisions, and abandoning wind, solar, electric vehicle, and solar manufacturing tax credits.
Manchin cited inflation in his decision to not support clean energy provisions, saying that he would wait for the release of July inflation numbers in August to revisit the issue. However, the greatest price increases for U.S. consumers by percentage come from fossil fuel products, and Manchin’s action takes away tools to help reduce demand for fossil fuels over the long term.
The most recent monthly Consumer Price Index report, which is used as a barometer of inflation, showed fuel oil (98.5% increase), gasoline (59.9% increase) and utility gas service (38.4%) as by far the largest percentage increases in a “basket” of household goods. The average price of retail electricity, which is in part set by the cost of natural gas, came in a distant fourth at 13.7% year-over-year.
Progressives responded to Manchin’s statements with fury. Senator Bernie Sanders accused Manchin of sabotaging Biden’s agenda and Senator Martin Heinrich asked why Manchin still has his position as chair of the powerful Senate Energy and Natural Resources Committee. This call to remove Manchin was echoed by climate scientist Michael Mann, who stated on Twitter that once Democrats win more seats in the Senate, they “can and should remove Manchin from all committee assignments.”
However, there appears to be little interest by Democratic Party leaders in holding Manchin accountable for stopping a key legislative priority for the Democratic Party, and Senate Majority Leader Chuck Schumer has refused to comment on the issue. Meanwhile, President Biden has said that he will move forward with executive action to address what he describes as a climate emergency, but he has not yet made an emergency declaration related to climate change.
It is unclear what tax credits were on the table in the reconciliation bill, but the Build Back Better legislation featured a wide array of clean energy provisions. These included:
extensions of the Investment Tax Credit (ITC) for solar and the Production Tax Credit (PTC) for wind
a “direct pay” option for the ITC and PTC
expanded tax credits for electric vehicles
tax credits for solar manufacturing along the value chain from polysilicon to modules
Without this legislation, the existing tax credits remain in place:
ITC for solar:
26% for projects that starting construction in 2022
EV tax credit: $7,500 for new vehicles from individual manufacturers until that manufacturer reaches a threshold of cumulative sales, at which point the credit expires
Expired for Tesla and General Motors vehicles (which make up the large majority of the EV market in the United States).
There are at present no dedicated tax credits for U.S. solar manufacturing.
However, it is easy to overstate the significance of this legislative setback on clean energy deployment, particularly for solar. Solar demand remains strong and is driven by a variety of factors. In the United States, states hold a greater degree of authority than in many other nations, and state-level renewable energy mandates and net metering policies have been important drivers of wind and solar deployment.
Additionally, procurement to meet corporate clean energy goals and the cost-competitiveness of solar and wind versus other forms of generation in more and more of the United States are also significant drivers. And the cost advantages of solar, wind, and electric vehicles has only increased as petroleum and natural gas prices have risen sharply over the last year.
As regards solar deployment, a greater concern is supply. CEA has confirmed that solar products from four different large solar manufacturers have been detained by Customs over the last month; three under the Uyghur Forced Labor Prevention Act (UFLPA) and one in the final days of the Hoshine withhold release order (WRO, an import ban). And while some of these suppliers have expressed confidence in their ability to provide the necessary paperwork and getting their shipments released, one has told developers that it will stop shipping to the U.S. market and will not have UFLPA-compliant product until the fourth quarter of 2022. This supplier is also temporarily shutting down a cell and module factory in Vietnam that served the U.S. market.
As explained in previous editions of the U.S. Energy Transition Report, the U.S. solar market is an import-dependent market and was already supply-constrained starting in the second half of 2021 after Customs began detaining solar shipments under the Hoshine WRO. While many of these detained shipments were later released and imports resumed in the second quarter of 2022, the interim nine months left U.S. developers and independent power producers in a state of shortage and high module prices that has yet to be resolved.
https://sunandwindbelt.com/wp-content/uploads/2022/06/LOGO-SW_WEB-abstand.svg00Sophia.Tischingerhttps://sunandwindbelt.com/wp-content/uploads/2022/06/LOGO-SW_WEB-abstand.svgSophia.Tischinger2022-07-26 13:54:422022-07-26 13:54:43Joe Manchin Scuttles Clean Energy Legislation, Again
The U.S. Department of Energy (DOE) has stated that developers are planning to build more than 6 gigawatts of offshore wind plants in the United States over the next seven years. In an issue of Today in Energy, DOE notes that most of these projects are on the Atlantic Coast, including projects off the coast of New Jersey, Maryland, and Virginia, as well as a project in Lake Erie of the coast of Ohio. A chart provided by DOE shows the first large projects coming online in 2024 to bring the nation to over 2 gigawatts of capacity and then growing steadily to reach over 5 gigawatts in 2027.
An increasing number of Americans are expressing interest in getting an electric-only vehicle for their next car, according to a survey by Consumer Reports. The survey found that 14% of Americans say that they would get an electric vehicle if they were to buy or lease an EV today, compared to 4% when the same survey was issued in 2020. Another 22% said that they would seriously consider one.
However, only 2% of Americans currently have a battery electric vehicle, and only 9% say they are very familiar with the fundamentals of owning an EV. A majority of respondents cited charging logistics (61%) range (55%) and the cost of buying, owning, and maintaining an EV (52%) as barriers.
S&P Global has identified 23 different hydrogen “hub” projects in the United States and five in Canada that have been proposed by developers. Many of the U.S. projects are vying to take advantage of the $8 billion in funding for four regional hydrogen projects that was made available in the Infrastructure Investment and Jobs Act.
While 13 of these are “green hydrogen” projects, five would utilize natural gas, and eight would be powered by various mixes of renewable energy, natural gas, and nuclear power. The geography also varies widely, with projects across North America from Southern California to Canada’s Nova Scotia.